Introduction: A Simple Map for Complex Sitting
Here is a clear claim: better chairs come from better measurement. An office chair manufacturer faces the same core truth every day—comfort must be measured, not guessed. Picture a project team at 10 a.m., shoulders tight, shifting in their seats after a long call. Recent workplace surveys show that nearly four in ten desk workers feel lower-back strain within two hours. If that is the daily baseline, what would change if we mapped pressure, posture, and motion like a science lab does? (Not just soft foam and hope.) And how would that change purchase choices and factory planning?
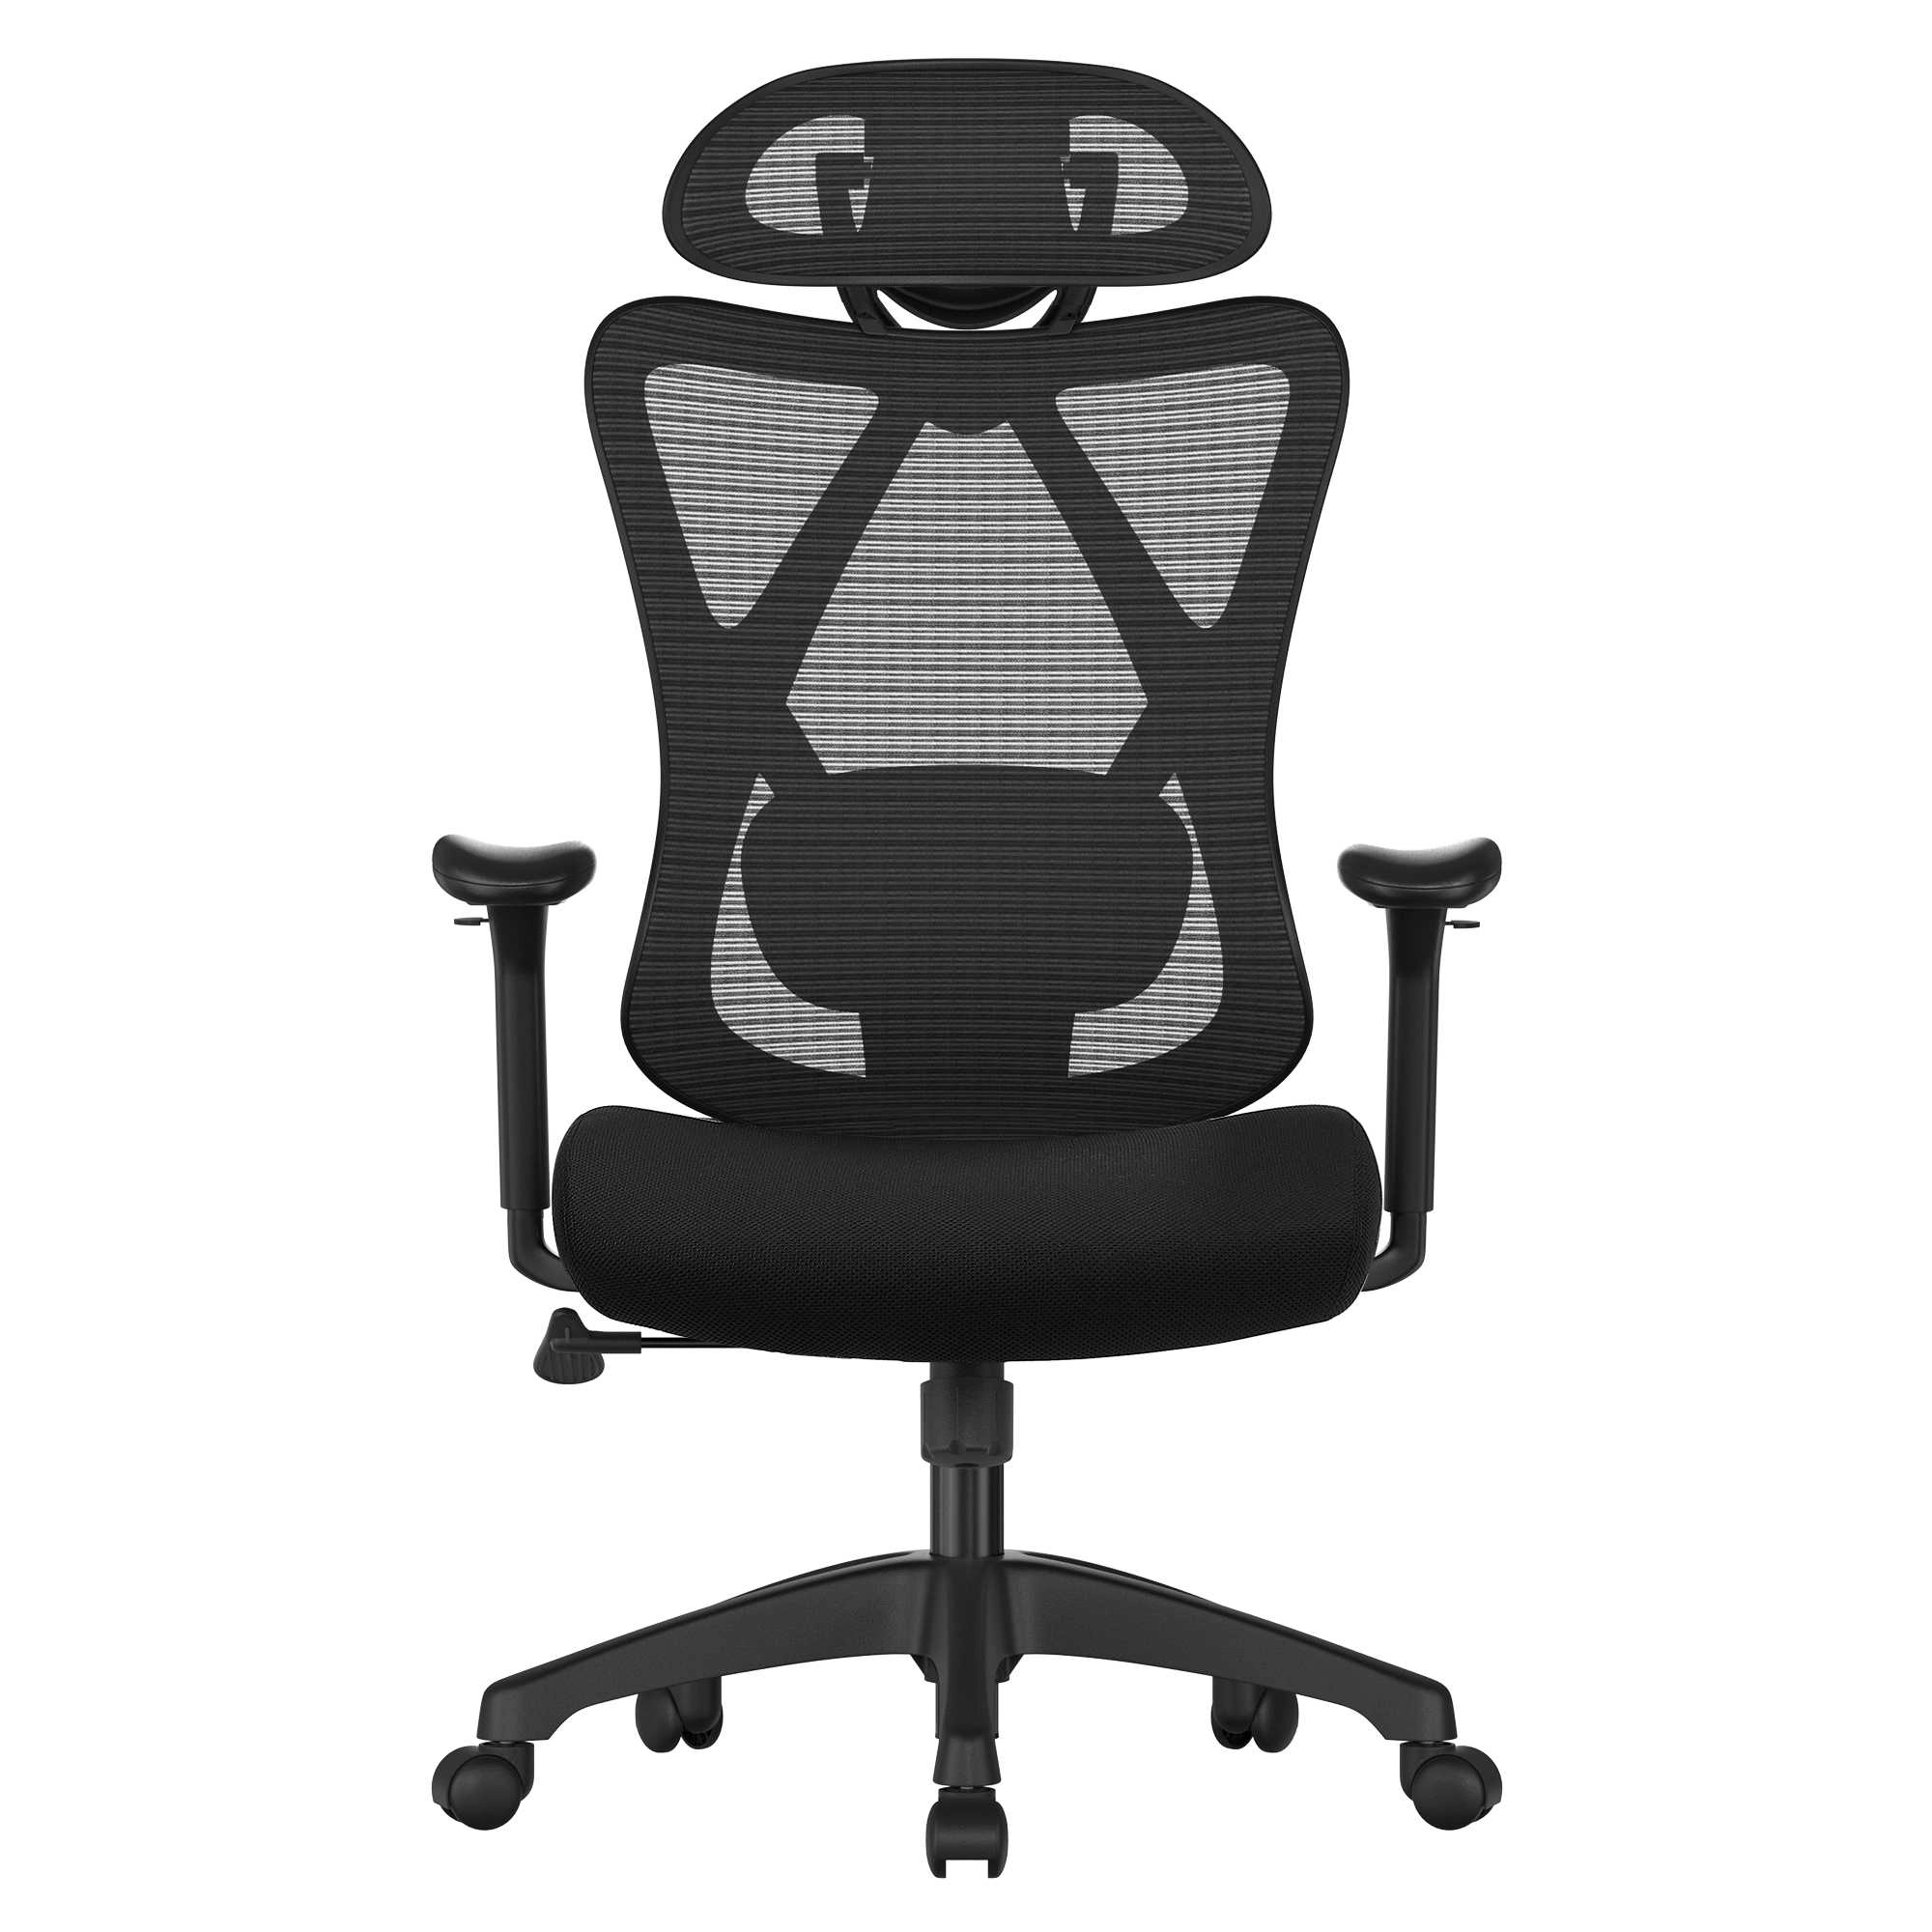
Technical? Yes, but also practical. Good seating shares three pillars: stable load paths, tuned lumbar geometry, and repeatable build quality. These are not fancy buzzwords. They are testable ideas. Think about seat pressure maps, torque consistency in the tilt assembly, and the tensile behavior of mesh under heat. Each one tells you if comfort will last. So, the question is simple: Are we comparing chairs by looks, or by data that tracks real use and real bodies? Let’s walk through that comparison, step by step, and see where suppliers shift the outcome—because they do. Next, we dig into what most users feel but cannot name, and how to catch it before it hits the return bin.
Part 2: Hidden Pain Points the Supplier Has to See
What are we missing?
To go deeper than Part 1, we need the supplier view. A capable office chair supplier shapes comfort at the source: parts, process, and proofs. Look, it’s simpler than you think. Small misses add up. Seat pans that pinch under the thigh. Armrests that wobble after a month because the fastener torque drifts. A gas lift cylinder that drops a few millimeters per week. Users can’t name these defects, but their backs can. Hidden heat build-up under dense foam is another one—funny how that works, right? These issues slip past a glossy spec if no one measures mesh tensile strength under humidity, or checks injection molding tolerances near screw bosses. Add in BIFMA load rating tests, and you get a clearer head-to-head than any showroom spin.
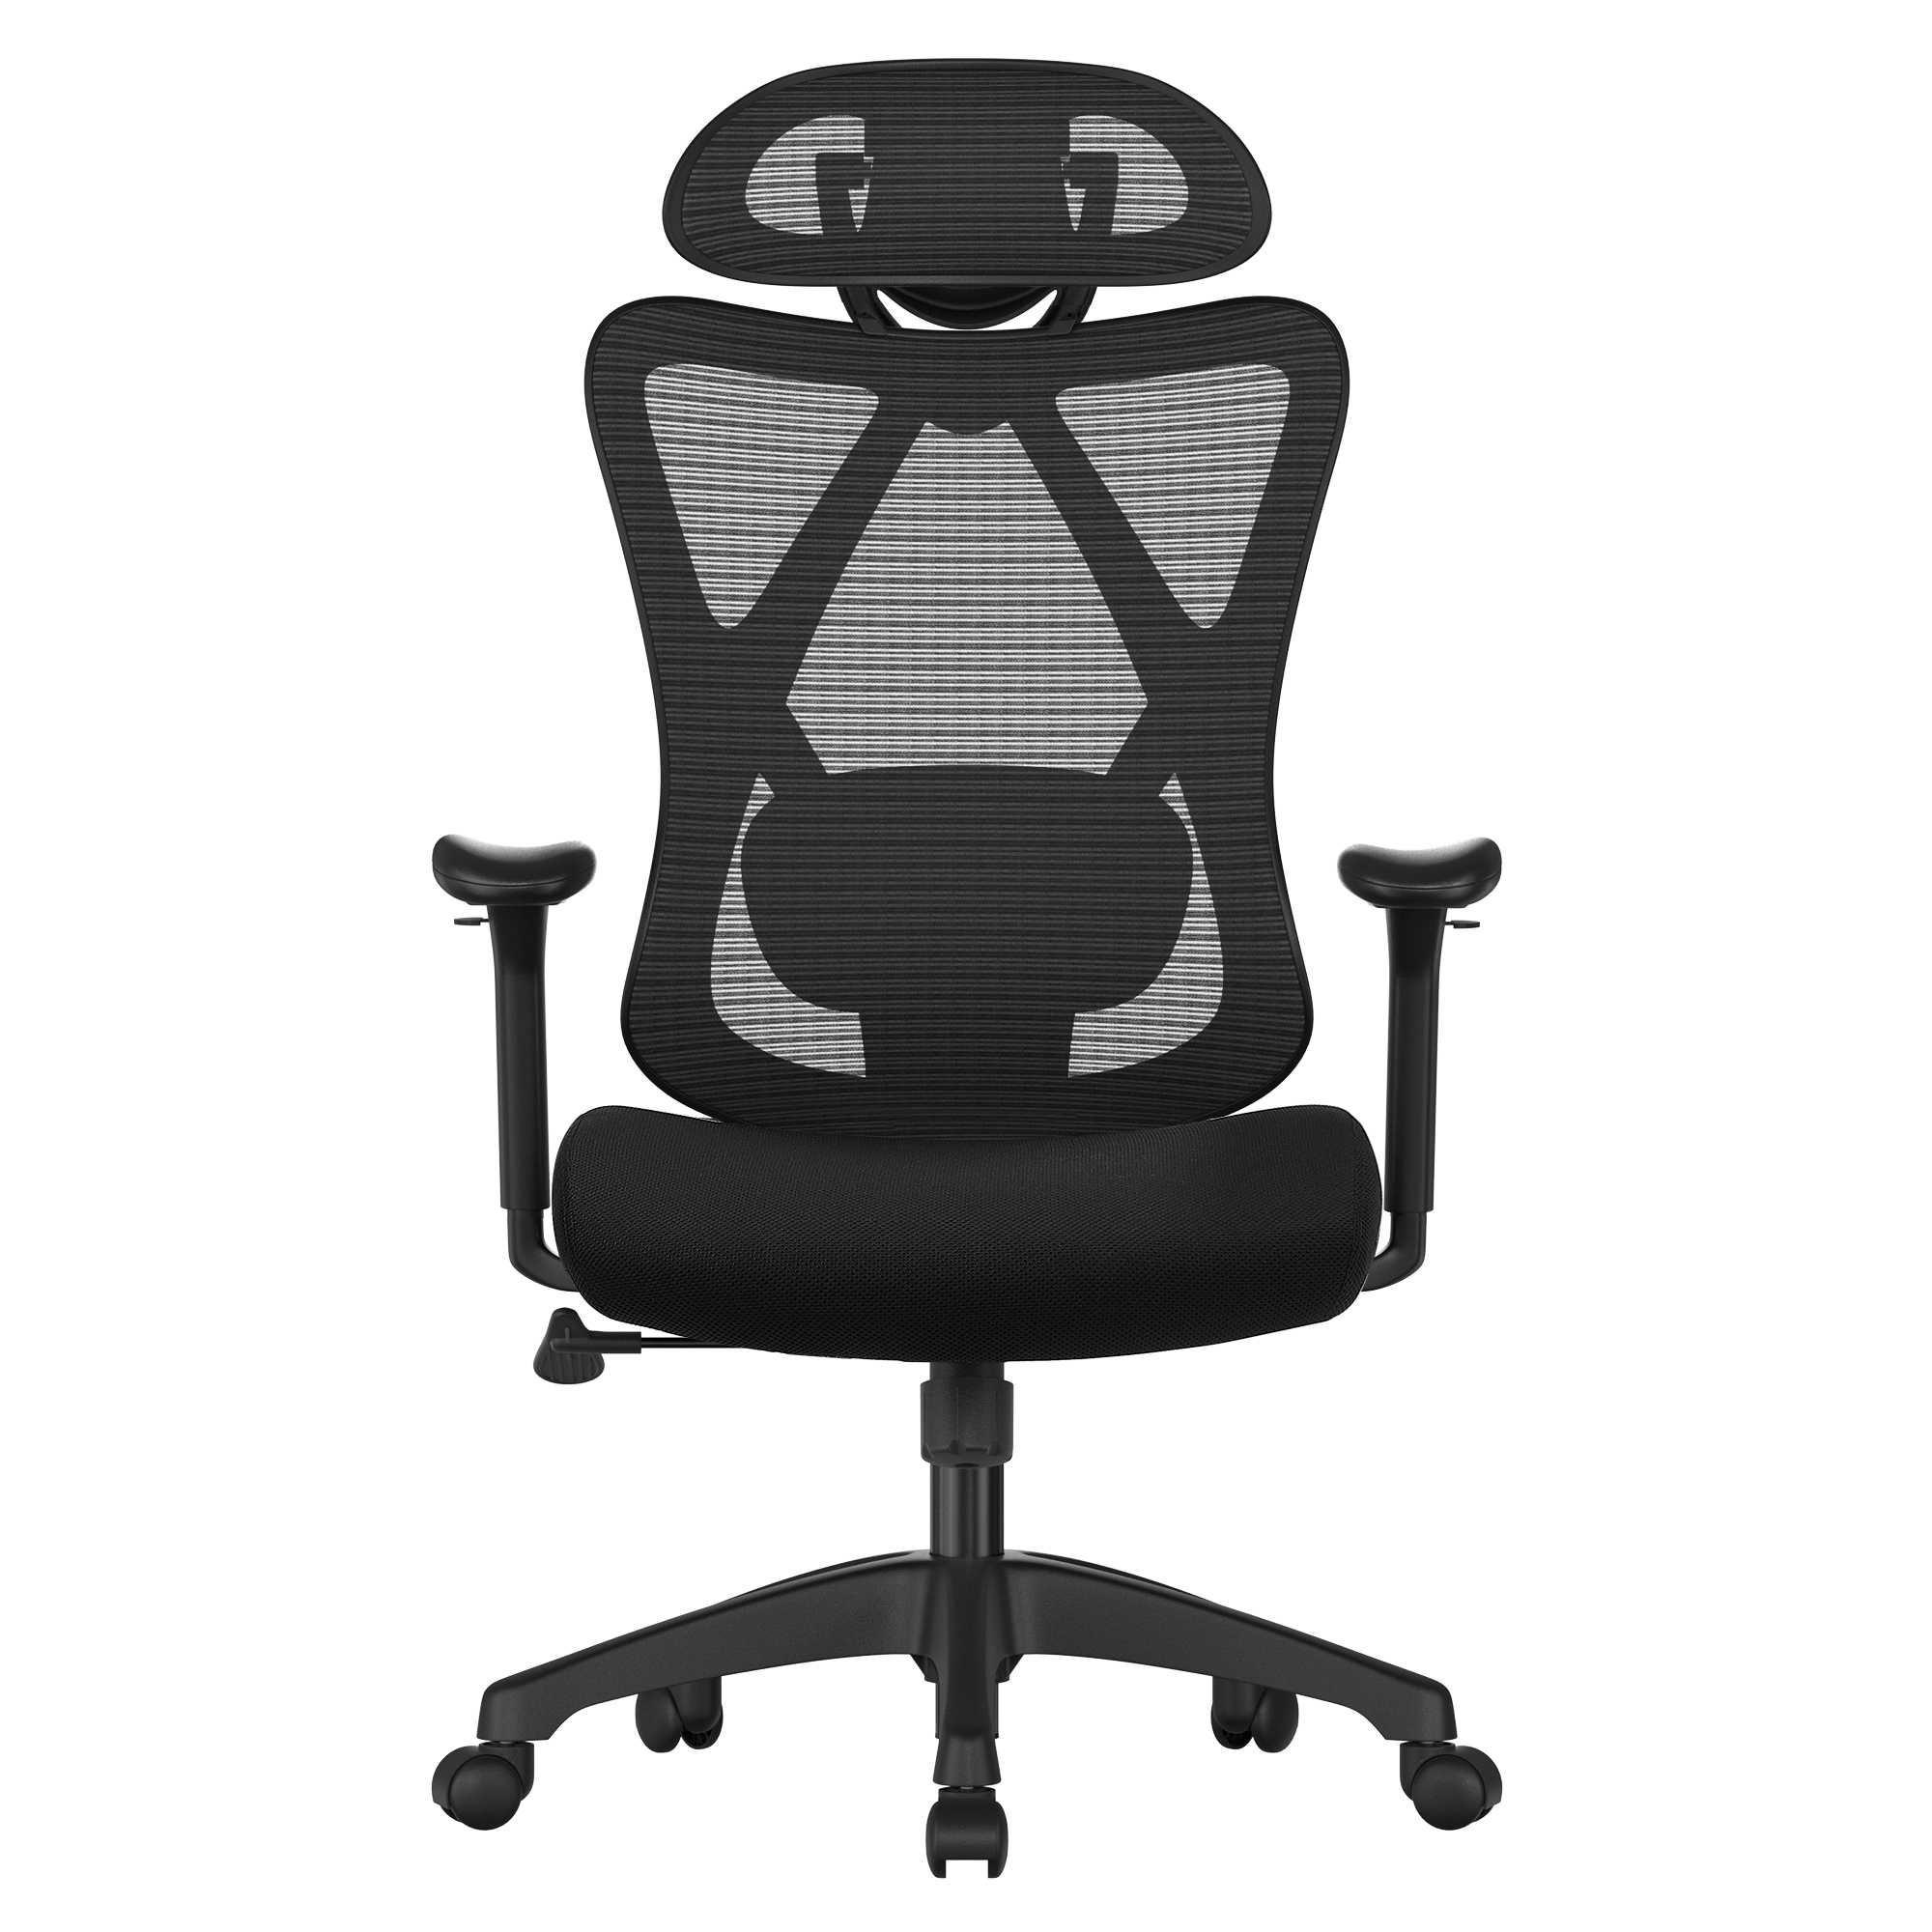
Traditional fixes often mask the root cause. Thicker foam may feel fine on day one, then bottom out by day thirty. A wider backrest looks supportive, yet the lumbar arc may not match the sacral curve. The tilt-lock mechanism can meet duty cycles, but if the tilt tension spring range is narrow, small people float while tall people sink. The lesson is to instrument your decisions. Record torque settings on the hinge. Track recline friction curves. Scan pressure zones over a 2-hour sit. These are small acts of control that prevent big returns—and yes, it matters. When suppliers hold the line on process controls, the user gets quiet, steady comfort, not just showroom comfort.
Part 3: Comparative Paths and What’s Next
What’s Next
Looking ahead, two paths split. One path treats chairs as parts in a box. The other treats chairs as platforms backed by test data and traceable builds. The second path is winning because new principles make it practical. Think digital twins at the jig, where every seat is ghost-tested against target pressure maps. Think QC rigs with edge computing nodes that log tilt torque signatures in real time. Add QR traceability to link a chair’s recline feel to the exact lot, mold cavity, and clamp force that shaped it. Even low-voltage actuators for headrest or lumbar can run stable if paired with tuned power converters and load distribution logic. When you compare vendors on this future curve, an office chair supply partner is more than a shipper; it is a process that repeats comfort, chair after chair.
Here is the fast summary without the buzz. Data beats guesswork. Comparative testing beats catalog claims. Platform thinking reduces warranty noise. From case runs we’ve seen, “silent failures” drop when the plant logs torque variance and pressure-map drift; returns fall, too. Users don’t report “better torque repeatability.” They just sit longer without fuss—funny how the body reports success in quiet moods. If you need a simple decision frame, try three checks: 1) Comfort fit index: measure pressure spread under the thigh and lumbar; keep hot spots below a set kPa band across sizes. 2) Durability index: verify cycle counts to noise onset in the tilt and arm joints; aim for long gaps before the first squeak. 3) Trace index: confirm full part genealogy from lot to chair ID in under a minute. Use those three, and choices get clearer. For builders and buyers alike, that is the road to fewer returns and more focused work with SONGMICS HOME B2B.